
About diagonaldiagrams
diagonaldiagrams is a Python library and MCP server for agents that turn Mermaid, JSON, or tabular data into diagrams and charts. It checks SVG output for layout problems and reports errors with suggested fixes.
Key features
- 01Draws Mermaid, JSON, and CSV inputs
- 02Creates diagrams and charts as SVG
- 03Audits text and connector layout
- 04Returns errors with suggested fixes
- 05Exports PNG, PDF, draw.io, and Excalidraw
Use cases
- 01Generate flowcharts from Mermaid descriptions
- 02Create charts from CSV data
- 03Check diagrams before adding them to documentation
MCP support
The MCP server lets MCP clients provide diagram specifications and receive generated SVGs and audit results.
Configuration
Local server config is the same for every client. Copy it into your client’s MCP config file.
Tools
9Saved tool list · updated 2w ago
| Parameter | Type | Required | Description |
|---|---|---|---|
| type | string | No | Figure type to describe, e.g. flow, arch, iso, bar, style or story. Omit to list all types. |
Details
From the project READMEdiagonaldiagrams


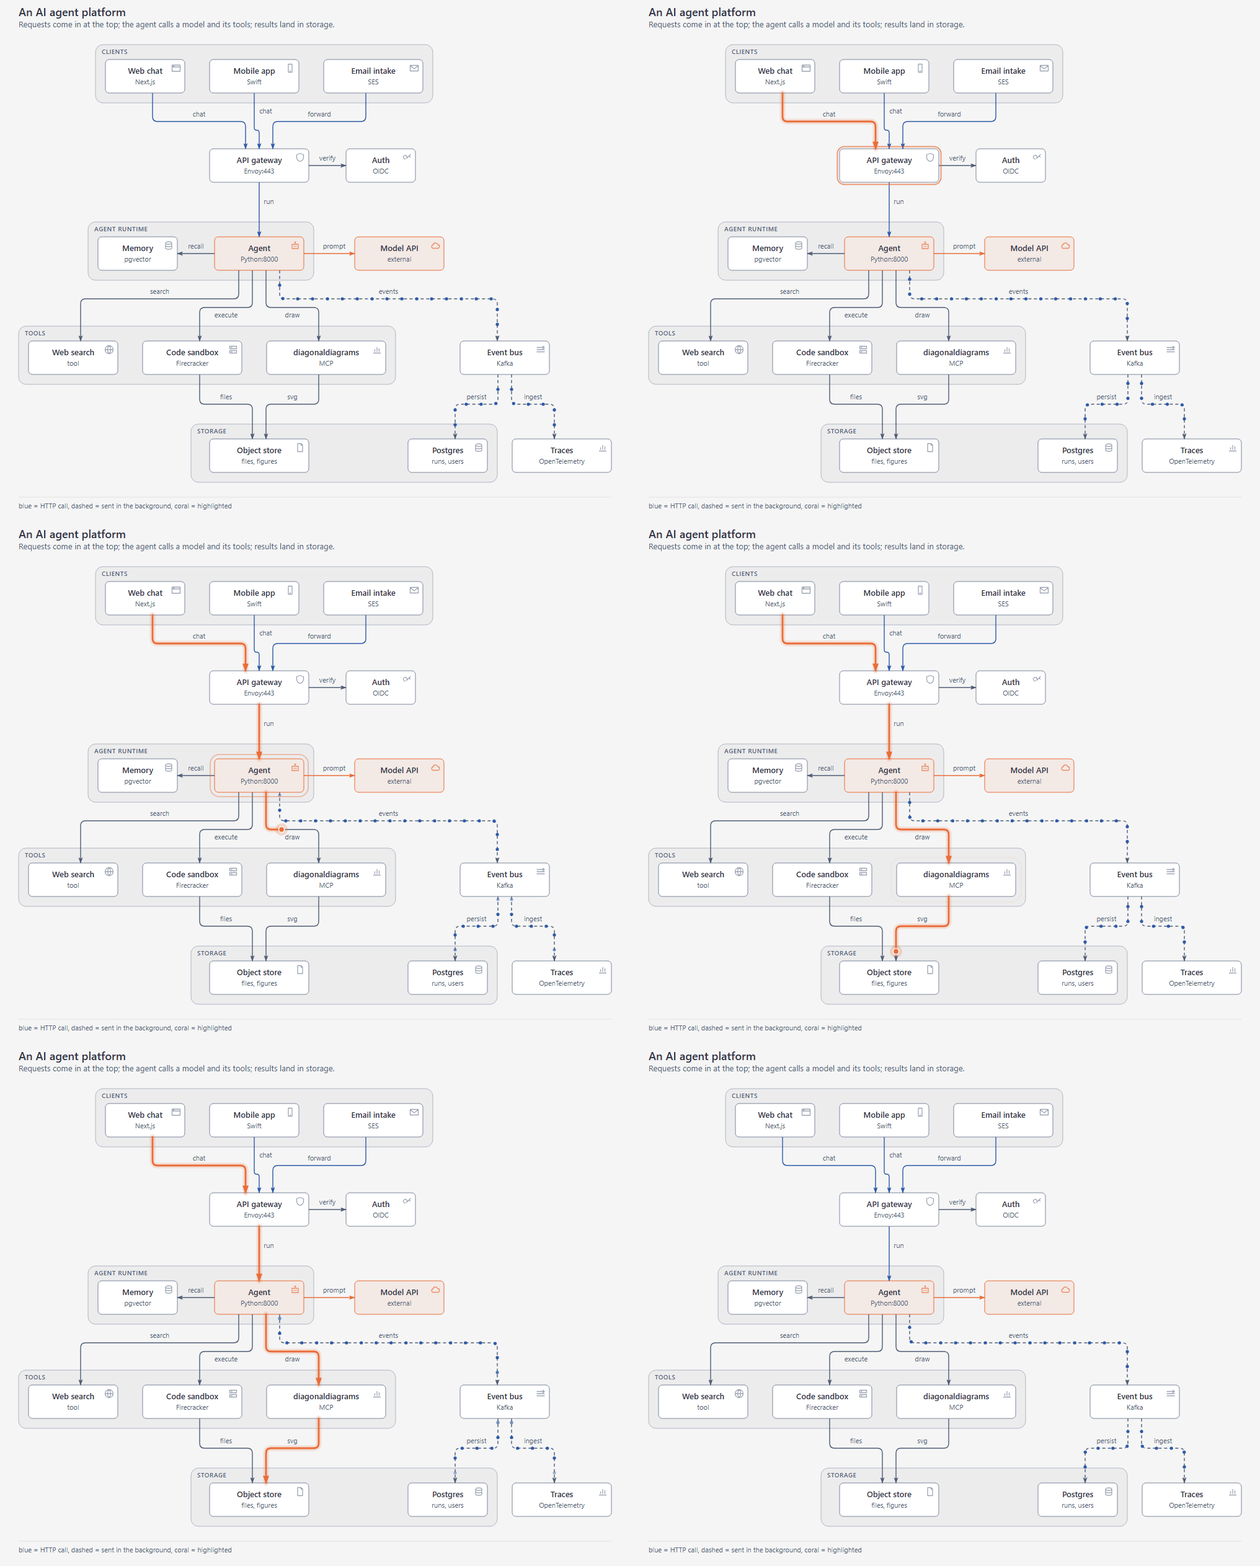
diagonaldiagrams is a Python library and MCP server that lets an AI agent draw diagrams and charts as SVG, and check them for overlapping text, arrows through boxes and text that spills, before showing them.
Site: filmed examples, benchmarks and a gallery.
How it works
- Describe. The agent writes a short description of the figure, in Mermaid, JSON or CSV.
- Draw. diagonaldiagrams lays it out and saves an SVG.
- Check. It audits the drawing and prints one line of JSON: all clear, or what is wrong and how to fix it. The agent reads that line instead of a screenshot.
$ diagonaldiagrams mermaid flow.mmd -o flow.svg
{"ok": true, "svg": "flow.svg", ..., "items": 3,
 "layout": ["row 1: Start", "row 2: Ready? (decision)", "row 3: Done"]}
When ok is false, each error comes with a fix.
Install
Needs Python 3.11 or newer.
Command line
pip install diagonaldiagrams
MCP (Cursor, Claude Desktop and other MCP apps). Add this to the app's MCP settings; it needs uv. The server is in the official MCP registry as io.github.lucas19919/diagonaldiagrams.
{
  "mcpServers": {
    "diagonaldiagrams": { "command": "uvx", "args": ["diagonaldiagrams", "mcp"] }
  }
}
Claude Desktop can also open the .mcpb file from the latest release.
Claude Code
/plugin marketplace add lucas19919/diagonaldiagrams
/plugin install diagonaldiagrams@diagonaldiagrams
Any other agent: tell it Install diagonaldiagrams from https://github.com/lucas19919/diagonaldiagrams. It follows the install skill, then draws with the drawing skill. The short version for models is llms.txt.
What it draws
| Command | Input | Draws |
|---|---|---|
mermaid | flowchart, sequenceDiagram, erDiagram | A flow, a sequence, or a schema |
flow, arch, seq, schema | JSON | The same four, from a spec |
iso | JSON | A layer stack in isometric 3D, with links between layers |
bar, line, scatter | CSV | A comparison, a trend, a relationship |
geo | CSV or GeoJSON | Places on a built-in coastline |
chart <type> | CSV or JSON | About 60 more |
describe <type>prints the spec shape for any figure type.--fit columnsizes a figure for a README or docs page.slideis the default, andpageis for print.storyturns one figure into several views in one page, and--giffilms it when ffmpeg is installed.applyedits a spec with a JSON patch, andexportwrites PNG, PDF, draw.io or Excalidraw files.
How it compares
Measured on 2026-10-19 against Mermaid CLI and Pele, on version 0.8.0, with the same four flowcharts of 5 to 40 steps.
- Speed. A 20-step flowchart takes 152 ms, about 15 times faster than Mermaid CLI (2,340 ms) and about 1.5 times slower than Pele (101 ms).
- Tokens. An agent used 4.4k to 6.4k tokens per figure at every size. At 5 to 20 steps Pele and Mermaid CLI used fewer (1.3k to 4.0k). At 40 steps diagonaldiagrams used 6.4k, Pele 6.3k and Mermaid CLI 15.4k. This is two runs, so treat it as a small sample.
- Quality. In blind pairs, diagonaldiagrams was judged clearer than Pele 85% of the time and than Mermaid CLI 97% of the time on slide-sized figures. It lost where an architecture translated from Mermaid was sized for a narrow column: 0 of 8 against Pele.
The full tables, the method and the scripts to rerun them are in bench/.
Develop
python -m unittest discover tests/unit   # unit tests
python tests_smoke.py                    # the command-line contract
python scripts/golden.py                 # the reference figures, byte for byte
How the engine is put together: docs/ARCHITECTURE.md. How releases are made: PUBLISHING.md.
License
MIT. See LICENSE.
Comments
New to MCP?
From what the protocol is to installing your first server, these answers cover most first questions.
An open protocol that defines how AI applications connect to external tools and data in a uniform way. Clients talk to the model; MCP servers provide tools, resources and prompt templates. They exchange standard messages, so one server can be reused by many clients.